4. Interactions among ecosystem services
Following chapter explores three specific policy-relevant interactions among ecosystem services: synergies, trade-offs and bundles. By highlighting these three types of interactions, we are recognizing that although some properties of ecosystems may be susceptible to human intervention and control, others are not; understanding this distinction is essential if we are to manage ecosystem services to maximize human wellbeing (MA, 2005). Interactions among ecosystem services occur when multiple services respond to the same driver of change (chapter 2) or when interaction among the services themselves cause changes in one service to alter another (Raudsepp-Hearne et al., 2010).
4.1 Interactions among ecosystem services in trade-offs and synergies
Ecosystems provide multiple ecosystem services which influence each other. For decision making purposes we have to pay our attention to all relevant services and their interaction as simultaneous deliverance of several demanded ES could not be possible, restrain each other or create conflict. Decisions relating to natural resource management often revolve around ecosystem service trade-offs and involve services that interact synergistically (MA, 2005).
Term “trade-off” comes from economic analysis where it described losing one quality in return for gaining another. It is now more generally used for situations where a choice needs to be made between two or more things that cannot be had at the same time (Martín-López et al., 2014).
A synergy (win-win) can be viewed as where the use of one service increases the benefits supplied by another and a trade-off as a situation in which the use of one service decreases the benefits supplied by another service, now or in the future (after Bennett et al., 2009; Lavorel et al., 2011). ES synergies and trade-offs are causally linked (i.e. respond to the same driver or functionally interact), but it is not essential that they occur in the same location (e.g. upstream land-use conversion versus downstream flood risk).
ES trade-offs or synergies only occur if the considered ES interact with each other. It may be due to simultaneous responses to the same driver or due to physical interaction among ES (i.e. fodder/biomass) (Bennett et al., 2009). Drivers could include ES use, ecological changes, management regime, investment choices, etc.
Many trade-offs can be modified by technology or by human or institutional services that regulate access to and distribution of ecosystem services. For instance, a trade-off may exist between agricultural production and species richness, yet we can use technological advances to increase agricultural production and make our farms more diverse at the same time.
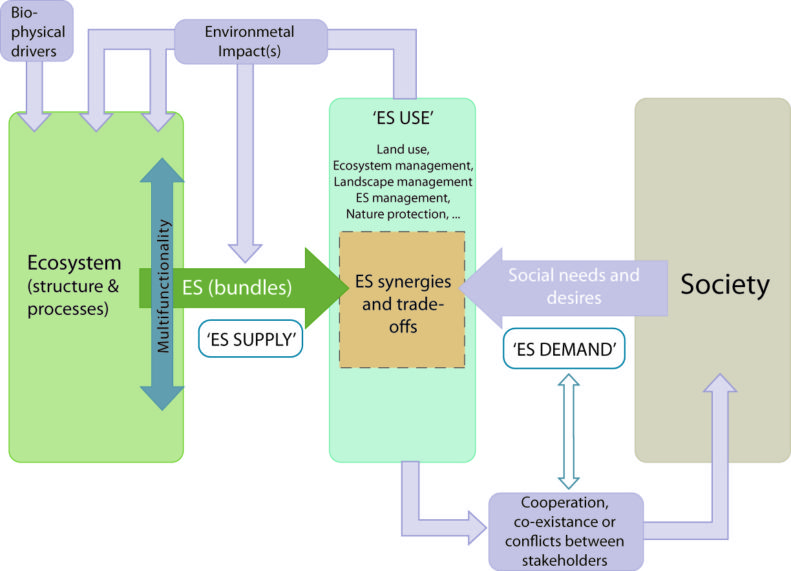
In ES context term “trade-off” is used to describe instances such as conflicting land-uses, a negative correlation between spatial occurrences of ES, ES incompatibilities, rivalry and excludability of ES. The opposite term “synergies” is used to describe situation where the use of one ES directly increases the benefits supplied by another service. In other words, a synergism occurs when ecosystem services interact with one another in a multiplicative or exponential fashion. Synergisms can have positive and negative effects. Synergistic interactions pose a major challenge to the management of ecosystem services because the strength and direction of such interactions remains virtually unknown (Sala et al., 2000). But synergisms also offer opportunities for enhanced management of such services. For example, if society chooses to improve the delivery of an ecosystem service, and this service interacts in a positive and synergistic way with another ecosystem service, the resulting overall benefit could be much larger than the benefit provided by one ecosystem service alone. Trade-offs, in contrast, occur when the provision of one ecosystem service is reduced as a consequence of increased use of another ecosystem service. Trade-offs seem inevitable in many circumstances and will be critical for determining the outcome of environmental decisions (Fig.4.1). In some cases, a trade-off may be the consequence of an explicit choice; but in others, trade-offs arise without premeditation or even awareness that they are taking place. These unintentional trade-offs happen when we are ignorant of the interactions among ecosystem services or when we are familiar with the interactions but our knowledge about how they work is incorrect or incomplete. As human societies transform ecosystems to obtain greater provision of specific services, we will undoubtedly diminish some to increase others.
The simplest approach to deduce positive and/or negative associations among ES is visual map comparison to outline spatial relationships (Anderson et al., 2009), trade-off curves to detect trends (White et al., 2012) or star diagrams to compare the relative provision of ES within a bundle (Foley et al., 2005; Raudsepp-Hearne et al., 2010), but none of these graphic methods provide a quantification of the strength of the association. The most popular quantitative method to assess associations among continuous quantitative indicators is pairwise correlation coefficients. In the case of two categorical indicators, a chi-square test on the two-way contingency table can replace the correlation analysis. However, multivariate analyses represent a better alternative when considering more than two ES and are flexible regarding the nature of the indicator (i.e. quantitative, qualitative): Principal Component Analysis (PCA) when all ES indicators are quantitative, Multiple Correspondences Analysis (MCA) when all ES indicators are qualitative (nominal or binary) and Factorial Analysis for Mixed Data (FAMD – which combines a PCA on quantitative variables and a MCA on qualitative ones) to handle a combination of quantitative and qualitative indicators simultaneously. Regression-based methods between two ES indicators can also detect ES associations (Bennett et al., 2009).

Figure 4.1. Visualisation of analytical links between related concepts and the trade-off mechanism (Source: OpenNESS synthesis paper)
4.2 Interactions among ecosystem services in bundles
Particular way to assess trade-offs is to analyse their interaction spatially and/or temporally, where it is observable that ES appear in associations or so called “bundles”. ES bundles is the spatial coincidence of the delivery of a range of ecosystem services. Some authors expand the definition: Raudsepp-Hearne et al. (2010) suggest that they are “sets of ecosystem services that repeatedly appear together across space or time. Researchers (OpenNESS synthesis paper) propose that ES bundles are defined as “a set of associated ecosystem services that are linked to a given ecosystem and that usually appear together repeatedly in time and/or space”. Bundle analysis can identify areas where land management has produced exceptionally desirable or undesirable sets of ecosystem services.
Main methods to assess ES bundles are cluster analyses that objectively define the groups of ES that are significantly associated. Interaction between ES and their association in bundles can be analysed both by spatial analysis, where overlaps of ES supply potential are identified in landscape or administrative unit level, and by analysing matrix of assessed ES values. Different cluster analyses can produce different clusters as a result of the hypotheses specific to each clustering algorithm. Hierarchical clustering has successfully been used to define ES bundles using the distance between the economic values or social preferences (Martin-Lopez et al., 2012).
As an alternative, the K-means clustering algorithm can be applied to segregate ES into a pre-defined number of groups by minimizing within-group variability. Additional analyses can then be performed to obtain a more dynamic picture of ES associations by estimating their recurrence in space and time. A way to do so would be to compare correlation coefficients or results of multivariate or overlap analyses among different spatial units to check the spatial consistency of the observed associations. Results of statistical analysis could be represented as maps and can be used as basis to future scenarios (Fig. 4.2).

Figure 4.2. Ecosystem service bundle types represent the average values of ecosystem services found within each cluster. Clusters in the data were found to also be clustered in space, and each ecosystem service bundle type maps onto an area of the region characterized by distinct social–ecological dynamics, rep-resented by the bundle names. (Source: Raudsepp-Hearne, et al., 2010.)
Slides of the lecture”Interactions among ecosystem services”
Suggested reading:
Assessment, M. E., 2005. Millennium ecosystem assessment. Ecosystems and human wellbeing: a framework for assessment Washington, DC: Island Press.
Bennett, E. M., Peterson, G. D., Gordon, L. J., 2009. Understanding relationships among multiple ecosystem services. Ecology letters, 12(12), 1394-1404.
Kelemen, E., García-Llorente, M., Pataki, G., Martín-López, B., Gómez-Baggethun, E., 2014. Non-monetary techniques for the valuation of ecosystem service. OpenNESS Reference Book. EC FP7 Grant Agreement, (308428).
Martín-López, B., Iniesta-Arandia, I., García-Llorente, M., Palomo, I., Casado-Arzuaga, I., Del Amo, D. G., . González, J. A., 2012. Uncovering ecosystem service bundles through social preferences. PLoS one,7(6), e38970.
Raudsepp-Hearne, C., Peterson, G. D., Bennett, E. M., 2010. Ecosystem service bundles for analyzing tradeoffs in diverse landscapes. Proceedings of the National Academy of Sciences, 107(11), 5242-5247.


